Examples
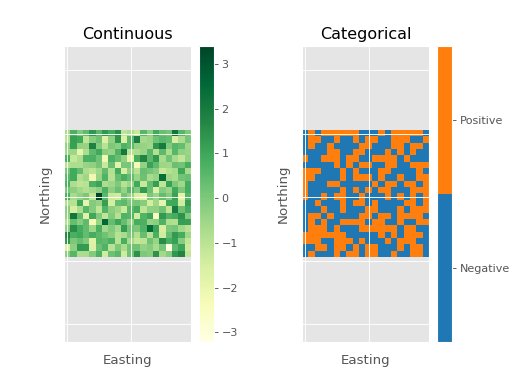
Rasters
import fieldmaps as fm
import matplotlib.pyplot as plt
import numpy as np

plt.style.use("ggplot")


# Make measurements.
rs = np.random.RandomState(seed=13)
raster = rs.normal(size=(20, 20))
labels = np.zeros(raster.shape, dtype=np.dtype("<U8"))
labels[raster < 0] = "Negative"
labels[raster > 0] = "Positive"
labels[raster == 0] = "Zero"

# Make maps.
fig, (ax1, ax2) = plt.subplots(1, 2)
fig.subplots_adjust(wspace=.5)
ax1.set_title("Continuous")
ax2.set_title("Categorical")

fm.raster_cont(raster, ax=ax1)
fm.raster_discrete(labels, ax=ax2)
fm.apply_theme(ax1, ax2)

plt.show()
(Source code, png, hires.png, pdf)
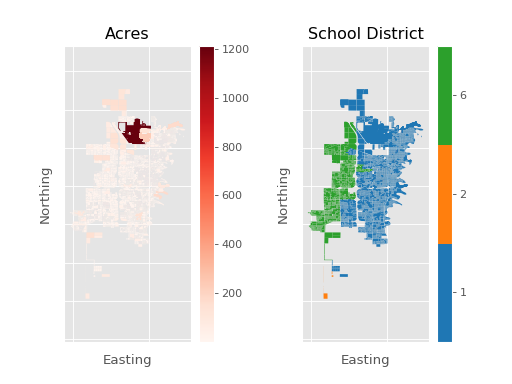
Polygons
import fieldmaps as fm
import matplotlib.pyplot as plt
import numpy as np
import requests

plt.style.use("ggplot")


# Fetch data.
src_url = (
    "https://raw.githubusercontent.com/HackFargo/Shapefiles-Archive/master/"
    "Footprints-Parcels/FargoParcels.geojson"
)
parcels = requests.get(src_url).json()
features = [
    feature
    for feature in parcels["features"]
    if feature["geometry"]["type"] == "Polygon"
]

# Extract measurements.
acres = [feature["properties"]["ACRES"] for feature in features]
school_districts = [feature["properties"]["SchoolDist"] for feature in features]

exteriors = [feature["geometry"]["coordinates"][0] for feature in features]
coords = np.array(exteriors)

# Make maps.
fig, (ax1, ax2) = plt.subplots(1, 2)
fig.subplots_adjust(wspace=.5)
ax1.set_title("Acres")
ax2.set_title("School District")

fm.poly_cont(acres, coords, ax=ax1, palette="Reds")
fm.poly_discrete(school_districts, coords, ax=ax2)
fm.apply_theme(ax1, ax2)

plt.show()
(Source code, png, hires.png, pdf)
Points
import fieldmaps as fm
import matplotlib.pyplot as plt
import numpy as np
import requests

plt.style.use("ggplot")


# Fetch data.
src_url = (
    "https://raw.githubusercontent.com/HackFargo/Shapefiles-Archive/master/"
    "Water-Utilities/WaterHydrants.geojson"
)
hydrants = requests.get(src_url).json()
features = [
    feature
    for feature in hydrants["features"]
    if feature["geometry"]["type"] == "Point"
]

# Extract measurements.
status = [f["properties"]["Status"] for f in features]
elevation = np.array([
    f["properties"]["Elevation"] for f in features
], dtype=np.float)

xy = [feature["geometry"]["coordinates"] for feature in features]
coords = np.asarray(xy)

# Make maps.
fig, (ax1, ax2) = plt.subplots(1, 2)
fig.subplots_adjust(wspace=.5)
ax1.set_title("Elevation")
ax2.set_title("Status")

fm.point_cont(elevation, coords, ax=ax1, palette="Blues", upper=1000)
fm.point_discrete(status, coords, ax=ax2)
fm.apply_theme(ax1, ax2)

plt.show()
(Source code, png, hires.png, pdf)

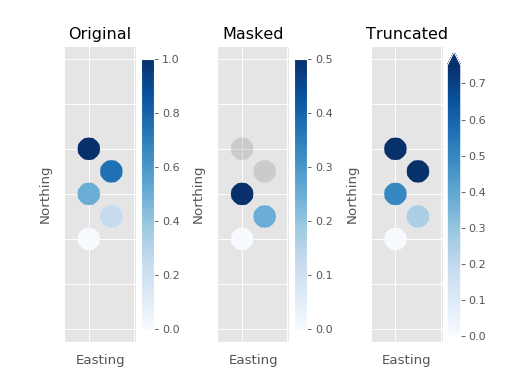
Masking and Truncation
from matplotlib import patches
import fieldmaps as fm
import matplotlib.pyplot as plt
import numpy as np

plt.style.use("ggplot")


# Make data.
polygons = [
    patches.Circle([0, 0], radius=.5),
    patches.Circle([1, 1], radius=.5),
    patches.Circle([0, 2], radius=.5),
    patches.Circle([1, 3], radius=.5),
    patches.Circle([0, 4], radius=.5),
]
coords = np.array([circle.get_verts() for circle in polygons])

bound = .75
measure = np.linspace(0, 1, num=len(polygons))
masked = np.ma.MaskedArray(measure, measure >= bound)

# Make maps.
palette = fm.settings.alternate_palette

fig, (ax1, ax2, ax3) = plt.subplots(1, 3)
fig.subplots_adjust(wspace=.7)
ax1.set_title("Original")
ax2.set_title("Masked")
ax3.set_title("Truncated")

fm.poly_cont(measure, coords, ax=ax1, palette=palette)
fm.poly_cont(masked, coords, ax=ax2, palette=palette)
fm.poly_cont(measure, coords, ax=ax3, palette=palette, upper=bound)

for ax in (ax1, ax2, ax3):
    fm.apply_theme(ax)
    xmin, xmax = ax.get_xbound()
    ax.set_xbound(xmin - .5, xmax + .5)
    ymin, ymax = ax.get_ybound()
    ax.set_ybound(ymin - .5, ymax + .5)

plt.show()
(Source code, png, hires.png, pdf)